Momentum is already shaping the T20 World Cup 2026 narrative. After just two rounds, net run rate gaps are widening, and the Super Eights equation is becoming clearer than many expected. On BJ Sports, fans tracking live permutations can see how even a single over impacts qualification probabilities. With venues offering batting-friendly surfaces early on true bounce, short square boundaries, and dew under lights, teams that maximized powerplay efficiency now sit comfortably at the top.
The points tables across all four groups reveal not just standings, but tactical clarity. Let’s break down each group and project who looks set for the Super Eights.
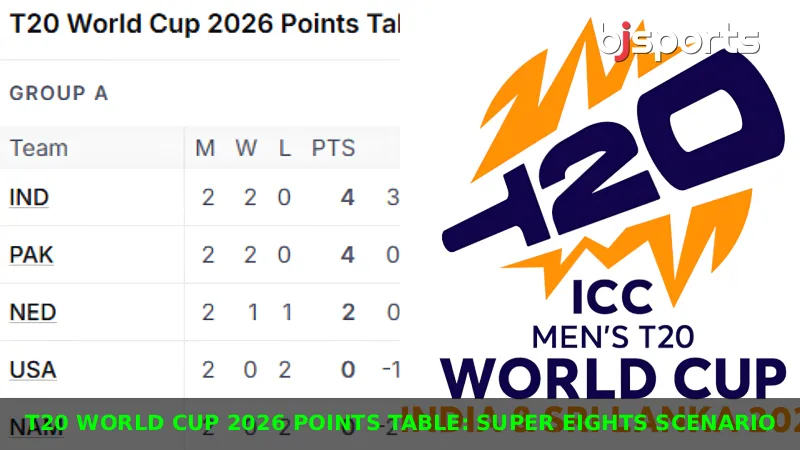
Group A: IND, PAK in Control
| Rank | Team | Matches | Wins | Losses | Points | NRR |
| 1 | India | 2 | 2 | 0 | 4 | +3.050 |
| 2 | Pakistan | 2 | 2 | 0 | 4 | +0.932 |
| 3 | Netherlands | 2 | 1 | 1 | 2 | +0.356 |
| 4 | USA | 2 | 0 | 2 | 0 | -1.525 |
| 5 | Namibia | 2 | 0 | 2 | 0 | -2.884 |
Two wins each have put India and Pakistan firmly ahead. India’s +3.050 NRR suggests dominant batting displays on flat tracks, while Pakistan’s efficiency with the new ball has kept margins healthy.
The analytics hub shows the Netherlands still mathematically alive, but realistically, Super Eights spots appear headed toward India and Pakistan. On batting-friendly pitches, chasing sides have enjoyed slight dew assistance, making toss strategy crucial. The platform’s ball-by-ball breakdown highlights how powerplay strike rates above 150 have separated contenders from strugglers.
Group B: Sri Lanka Surge
| Rank | Team | Matches | Wins | Losses | NRR | Points |
| 1 | Sri Lanka | 2 | 2 | 0 | +3.125 | 4 |
| 2 | Australia | 1 | 1 | 0 | +3.350 | 2 |
| 3 | Zimbabwe | 1 | 1 | 0 | +2.702 | 2 |
| 4 | Ireland | 2 | 0 | 2 | -2.175 | 0 |
| 5 | Oman | 2 | 0 | 2 | -4.306 | 0 |
Sri Lanka has combined aggressive top-order batting with disciplined death overs. Australia and Zimbabwe remain strong challengers, but with fewer games played, consistency is key.
The cricket portal’s live scores show Sri Lanka’s middle overs control as a defining factor, conceding under seven per over on true surfaces. Given remaining fixtures, Sri Lanka look the favorites to qualify, with Australia likely to edge Zimbabwe due to squad depth and big-match temperament. If pitches continue favoring strokeplay, Australia’s power-hitters could tilt the NRR race decisively.
Group C: Tightest Qualification Battle
| Rank | Team | Matches | Wins | Losses | NRR | Points |
| 1 | West Indies | 2 | 2 | 0 | +1.625 | 4 |
| 2 | Scotland | 2 | 1 | 1 | +0.950 | 2 |
| 3 | Italy | 2 | 1 | 1 | -0.352 | 2 |
| 4 | England | 2 | 1 | 1 | -0.650 | 2 |
| 5 | Nepal | 2 | 0 | 2 | -1.854 | 0 |
The defending champions, West Indies, have leveraged home-like batting conditions superbly. Three teams tied on two points create an intense NRR battle.
The data engine highlights England’s negative NRR as a concern despite one win. Scotland’s balanced bowling unit has adapted well to slightly slower surfaces used in afternoon matches. Projection-wise, the West Indies look secure, while Scotland’s superior NRR gives them a slight edge unless England delivers a dominant win to flip the numbers.
Group D: NZ, SA Dominance
| Rank | Team | Matches | Wins | Losses | NRR | Points |
| 1 | New Zealand | 2 | 2 | 0 | +1.919 | 4 |
| 2 | South Africa | 2 | 2 | 0 | +1.425 | 4 |
| 3 | Afghanistan | 2 | 0 | 2 | -0.555 | 0 |
| 4 | UAE | 1 | 0 | 1 | -2.763 | 0 |
| 5 | Canada | 1 | 0 | 1 | -2.850 | 0 |
New Zealand and South Africa have been clinical. New Zealand’s adaptability on slightly two-paced evening wickets stands out, while South Africa’s pace attack has exploited extra bounce.
With Afghanistan yet to secure points, qualification appears a two-horse race. The live tracker indicates both leaders maintain strong boundary-to-dot-ball ratios critical on surfaces that reward disciplined seam bowling.
Patterns Behind the Numbers
On BJ Sports, tactical graphics show that teams averaging above 9.5 in the power play have converted matches more consistently. That aligns with this year’s flatter decks and shorter boundaries. As fans follow through highlights and even livestreaming on Sportslivehub, the contrast between aggressive intent and conservative starts becomes obvious.
If current trends hold, India, Pakistan, Sri Lanka, Australia, West Indies, Scotland, New Zealand, and South Africa look the most probable Super Eights qualifiers. Yet T20 volatility means one explosive innings can reshape a group.
FAQs
What determines Super Eights qualification?
Points first, then net run rate if teams are tied.
Why is net run rate so important now?
Tight group standings mean even small winning margins impact qualification.
Where can fans track detailed match context?
Platforms like BJ Sports provide tactical breakdowns alongside real-time updates.
Disclaimer: This Today’s Trending (Blog) expresses the author’s personal insights and analysis. We encourage readers to consider the points discussed and draw their own conclusions.
 IND vs NZ: Where to Watch the India tour of New Zealand 2026 Live with Free Streaming
 Today’s Dolphins vs Warriors Match Pitch Report 2026: Can the Pitch Decide the Pool B Clash?
 South Africa vs Australia: Where to Watch the 2nd Test Live on TV and Online
 Today’s BAN vs ZIM Match Pitch Report 2026: How Will the Abu Dhabi Pitch Play Today?